
Obesity is a chronic lifestyle-related disease with metabolic disturbances like insulin resistance and dyslipidemia, leading to comorbidities such as type 2 diabetes and heart diseases. Animal models like high-fat diet-induced mice model closely mimics the human obesity and its effects, aiding obesity research.
Our team at Aragen specializes in developing diet-induced obesity mice models and offers downstream drug efficacy analyses. Customizing test panels to precisely match our customers’ specifics remains our prime focus.
This case study describes a comparative study to evaluate the effect of rimonabant and liraglutide using high-fat diet (HFD)-induced obesity in male C57BL/6 mice. Rimonabant, once sought as anti-obesity drug, acts as a cannabinoid receptor antagonist, and liraglutide is a glucagon-like peptide-1 (GLP-1) receptor agonist widely used for the treatment for type 2 diabetes mellitus (T2DM). Owing to its efficacy in weight reduction coupled with glycemic control, liraglutide is favored over rimonabant, offering a more holistic approach to combat obesity and T2DM, and its associated metabolic concerns.
Aragen’s experts compared the efficacy of rimonabant and liraglutide using HFD-induced obesity in male C57BL/6 mice. Animals (40-45g) were randomly assigned into four groups (n =10/group) and lean chow (given a normal diet) or high-fat diet (60 kcal% high-fat diet; HFD) for 14 weeks to induce obesity (Figure 1). The HFD groups (continued with HFD) were sub-divided into disease control group, rimonabant group (10 mg/kg) and liraglutide (LIRA) group (0.05 mg/kg). Animals were treated for five weeks with rimonabant and liraglutide.
We performed downstream analyses including treatment-mediated body weight change, blood glucose and insulin levels, oral glucose tolerance test (OGTT), insulin tolerance test (ITT), serum chemistry and histopathology examination (Oil-Red-O staining) with an objective to compare the anti-obesity and anti-diabetic effects of rimonabant and liraglutide.
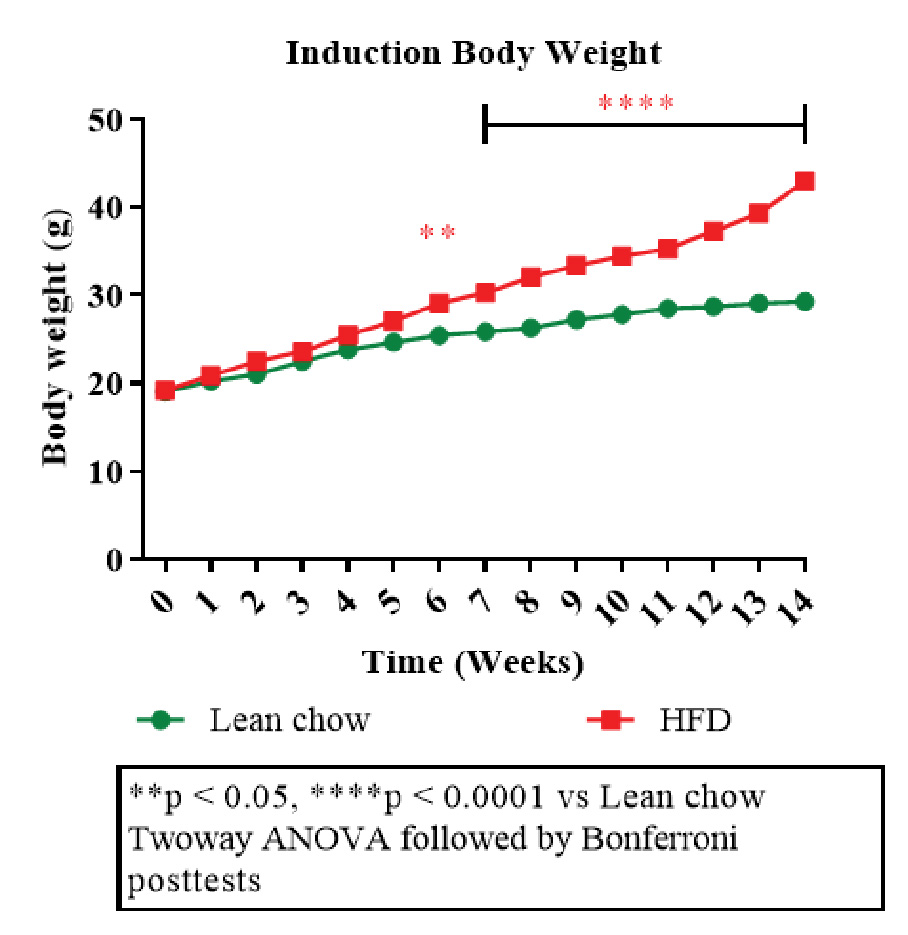
Figure 1: Disease induction body weight.
The plot depicting body weight changes over time among different groups (Figure 2A, B) showed a decrease in body weight in treatment groups (rimonabant and liraglutide) compared to the disease control group. This highlighted effectiveness of the interventions in improving insulin sensitivity and glucose tolerance. A notable decline in body weight during terminal fasting suggested that both the drugs reduced adiposity or improved energy expenditure.

Figure 2: A plot depicting change in body weight (g) over time (A) and percentage change in body weight (g) over time (B) including timepoints before insulin tolerance test (ITT fasting), oral glucose tolerance test (OGTT fasting) and terminal fasting.
An OGTT curve depicted the glucose levels change over time after administering an oral glucose load (2g/kg) to mice. As shown in figure 3A, rimonabant and liraglutide improved glucose tolerance compared to the control groups; liraglutide was more effective than rimonabant. Similar observation was confirmed from OGTT-area under curve (AUC) plot (Figure 3B) results. Rimonabant group had lowered AUC, suggesting improved glucose handling compared to disease control. However, liraglutide group had even lowest AUC, indicating better glucose tolerance than rimonabant.
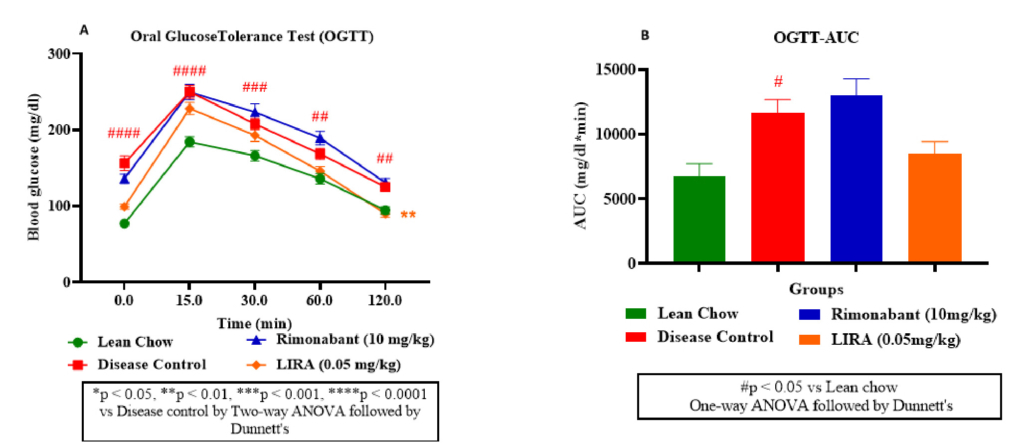
Figure 3: Glucose metabolism assessment. Oral glucose tolerance (OGTT) test (A); OGTT-area under curve (OGTT-AUC) (B).
Furthermore, as illustrated from ITT curve (Figure 4A), rimonabant and liraglutide treatments effectively lowered blood glucose levels, indicating improved insulin sensitivity. Liraglutide appeared more potent than rimonabant in enhancing glucose clearance with a lower ITT-AUC than rimonabant (Figure 4B).
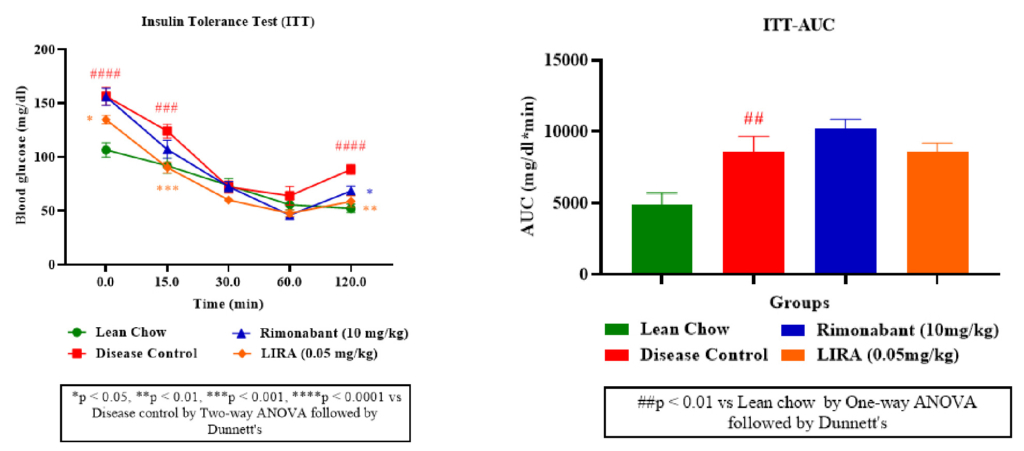
Figure 4: Insulin sensitivity assessment. Insulin tolerance (ITT) test (A); ITT-area under curve (ITT-AUC) (B).
Obesity is associated with steatosis (fatty liver) and perturbed liver enzymes profile. Therefore, plasma levels of aspartate aminotransferase (AST) and alanine aminotransferase (ALT)— two liver enzymes which rise in obesity were measured. Liraglutide and rimonabant treatments significantly reduced the elevated AST and ALT levels compared to the disease control (Figure 5A, B).Furthermore, rimonabant’s treatment demonstrated minimal impact on blood glucose levels, aligning with its known mechanism of action (appetite reduction rather than direct glucose regulation). Whereas liraglutide treatment, displayed a more pronounced effect on blood glucose reduction (Figure 5C).
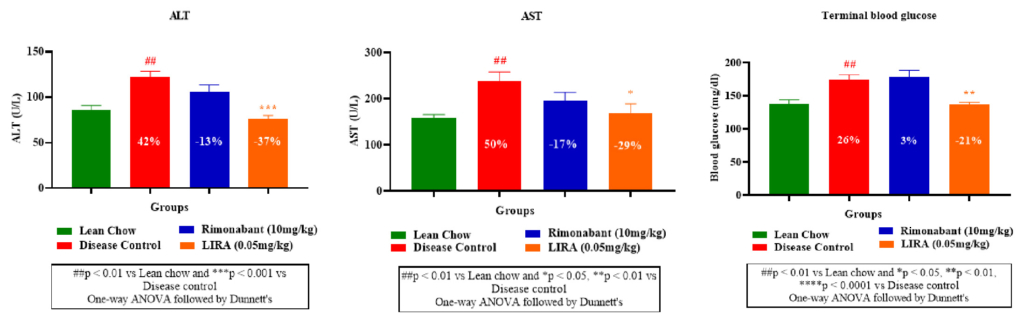
Figure 5: Plasma levels of aspartate aminotransferase (AST) and alanine aminotransferase (ALT) and blood glucose.
Furthermore, leptin level in disease control group was significantly higher than the treatment groups, indicating increased fat mass due to the diet. Whereas liraglutide and rimonabant treatments substantially diminished leptin levels (Figure 6A). Decreased insulin levels in liraglutide and rimonabant groups demonstrated their superior insulin sensitivity than disease control group (Figure 6B).
The extent of lipid accumulation in hepatic tissue was determined by Oil-Red-O staining. Liraglutide-treated liver tissue sections showed lowest fat deposition compared to other groups (Figure 7A). This finding was consistent with substantial decline in liver tissue triglyceride levels (Figure 7B) and lowest steatosis percentage in liraglutide-treated sections (Figure 7C). Overall, liraglutide had better efficacy than rimonabant in ameliorating the ill-effects of HFD-induced obesity. Thus, the results of our study corroborated with previously established findings.
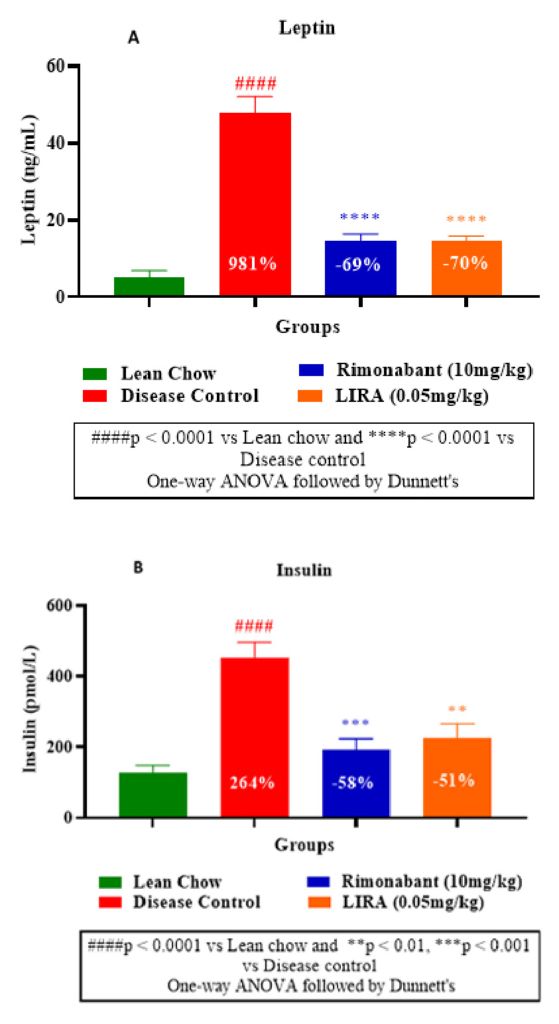
Figure 6: Plasma leptin measurement (A) and
insulin measurement (B).
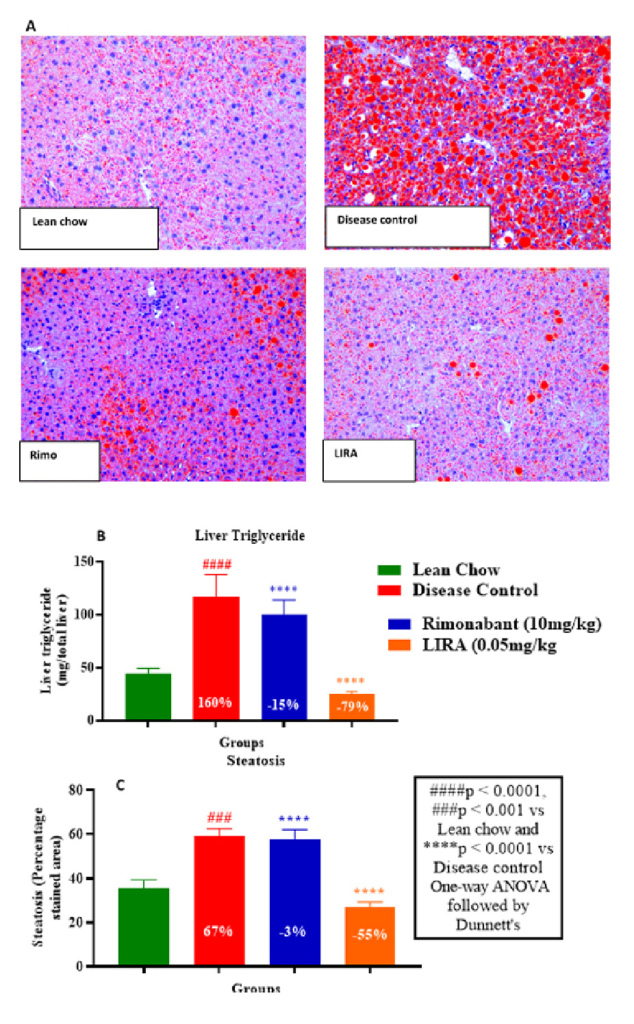
Figure 7: Histological examination by Oil-Red-O staining of hepatic tissue section (A); liver triglyceride levels (B) and percentage steatosis in liver tissues (C).
Aragen collaborates closely with clients to facilitate IND-enabling in vivo studies by providing:
